


University of Lisbon
Atlas of Social Attitudes
Data platform for exploring social and political attitudes across Europe for the University of Lisbon.
The Atlas of Social Attitudes brings together social science data from major cross-national survey programs, presented through interactive visualizations, dynamic maps, and data-driven stories. The platform makes high-quality survey evidence accessible to students, journalists, researchers, and policy analysts.
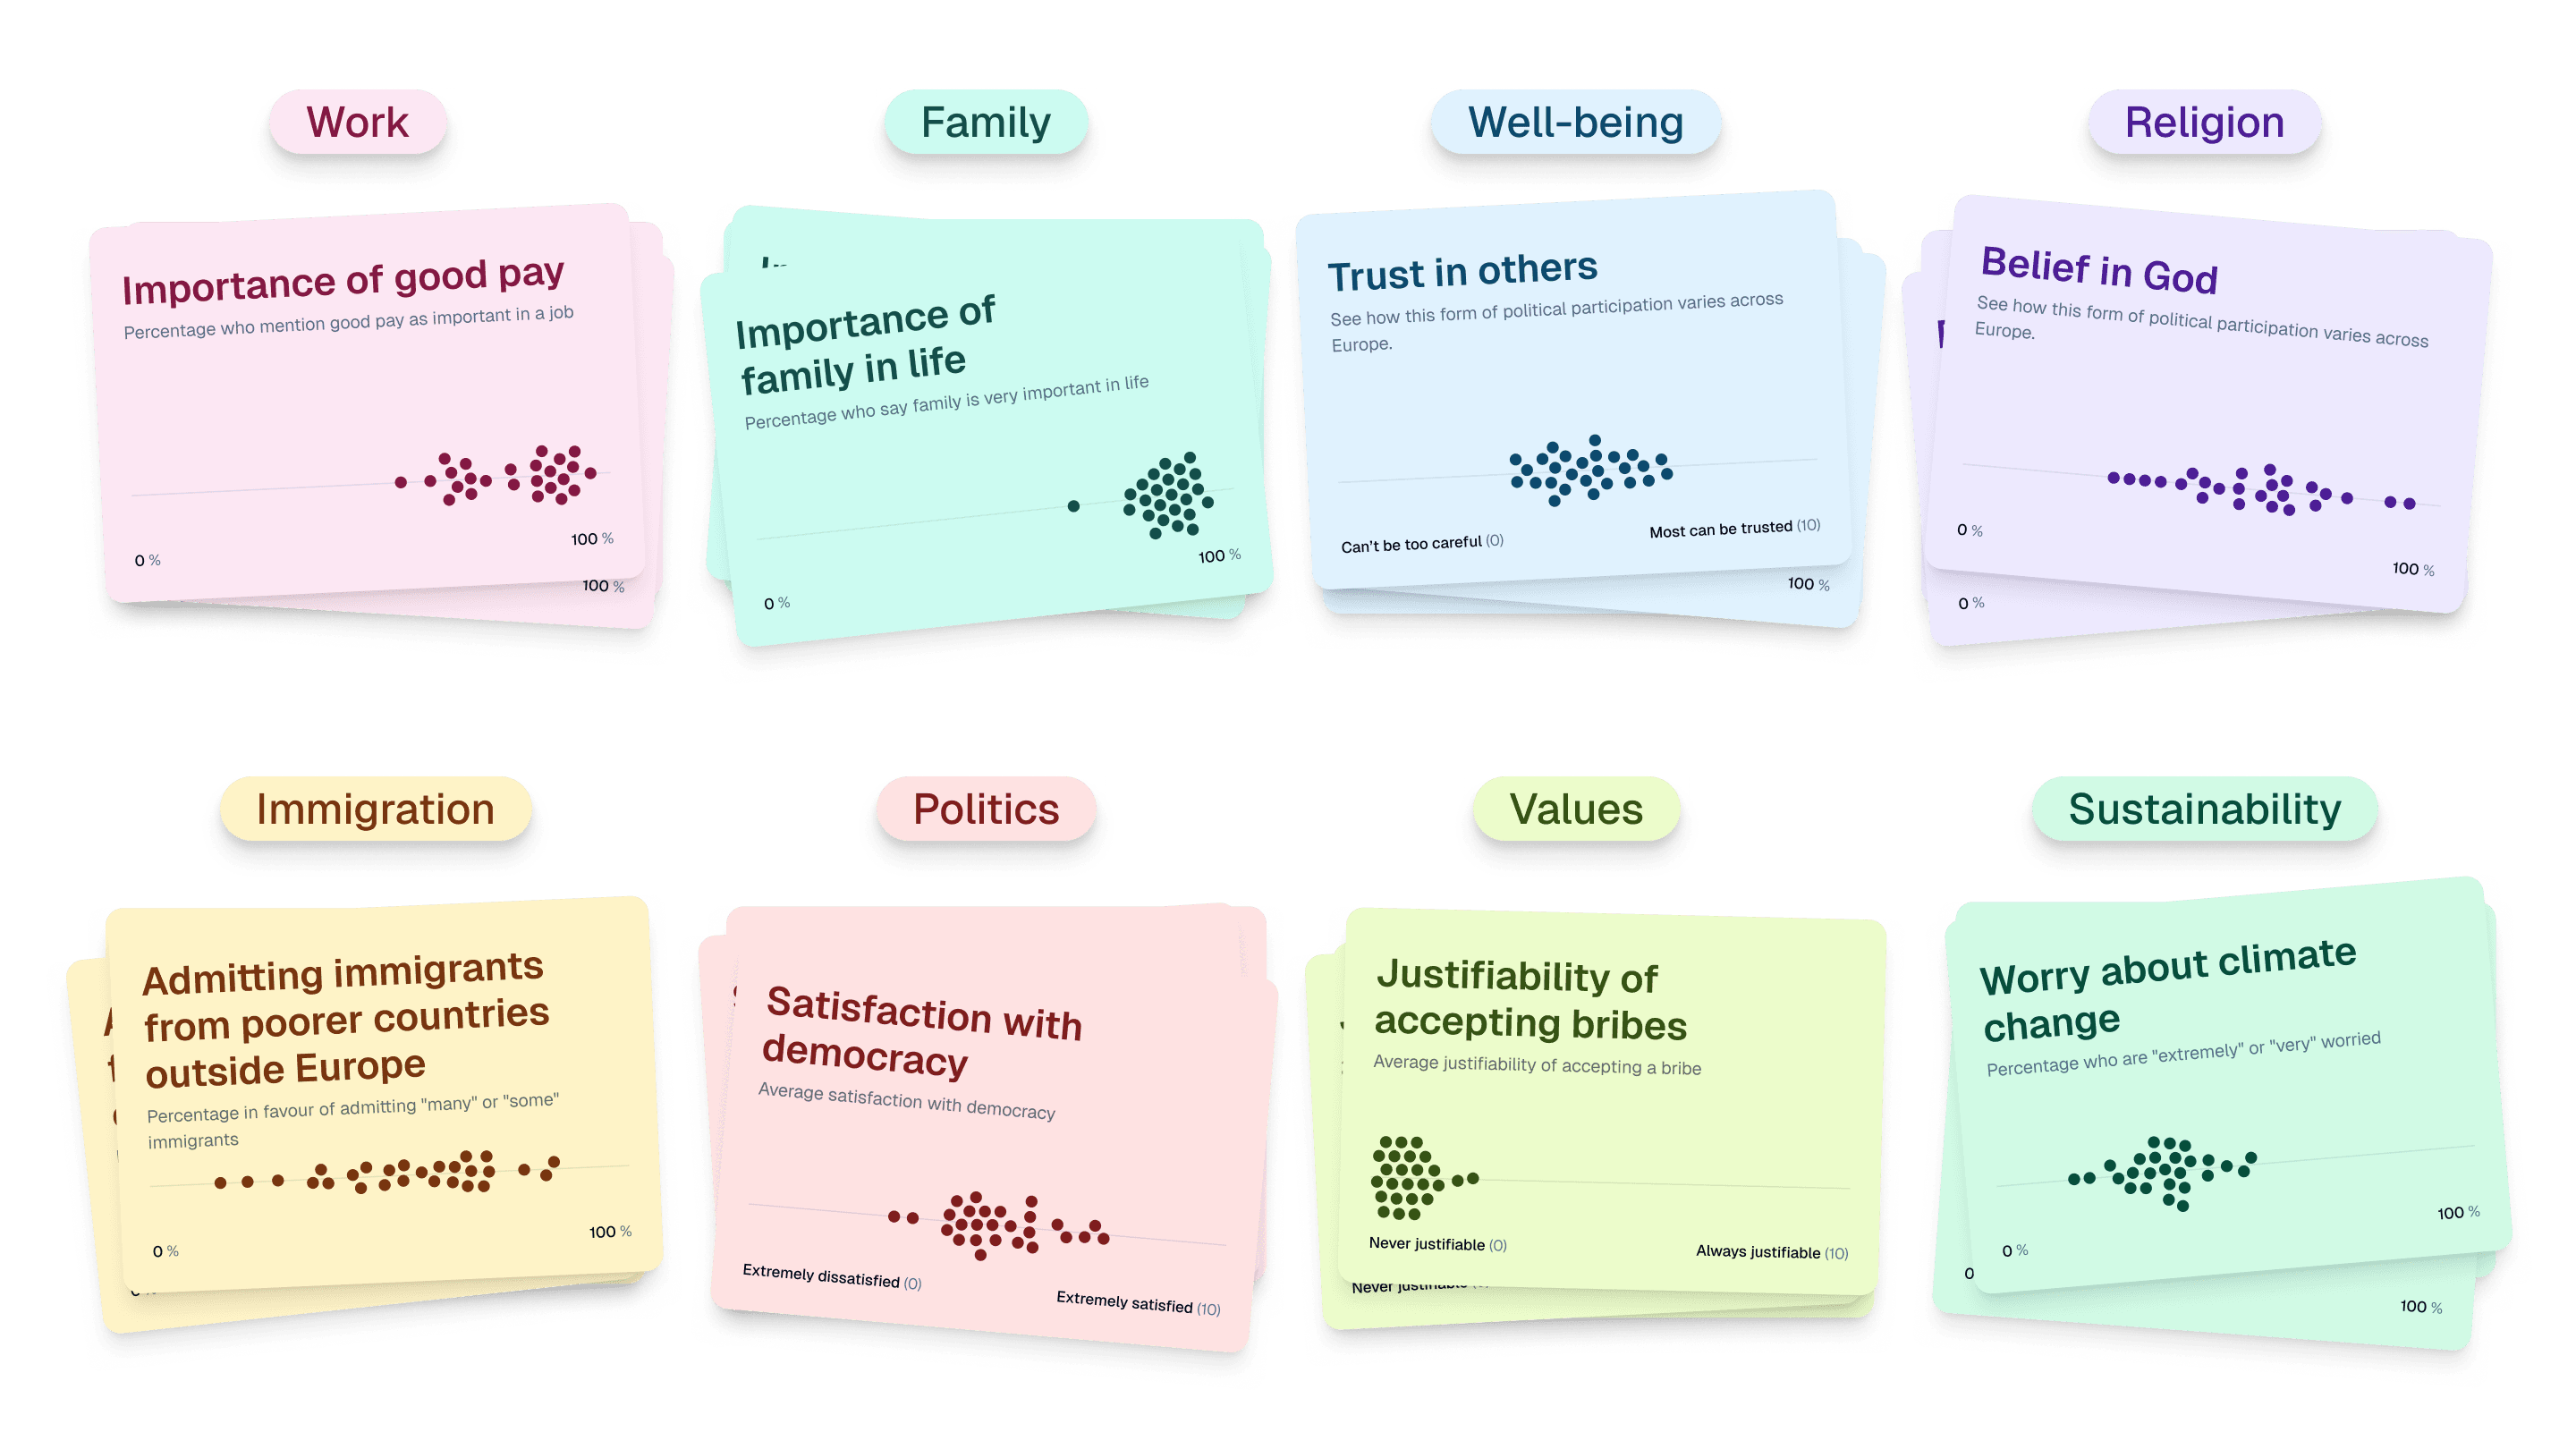
Explore insights by topic
The platform organizes selected indicators from different survey programs into eight topics, from work and family to politics and sustainability. Each topic groups related questions, making the evidence about social and political attitudes more visible, accessible, and useful in public debate.

See trends over time, place, and response
Every indicator can be explored in three views. A map shows how attitudes vary across European countries. A trend chart tracks how opinions have shifted over time. A breakdown view reveals the distribution of responses across answer options.


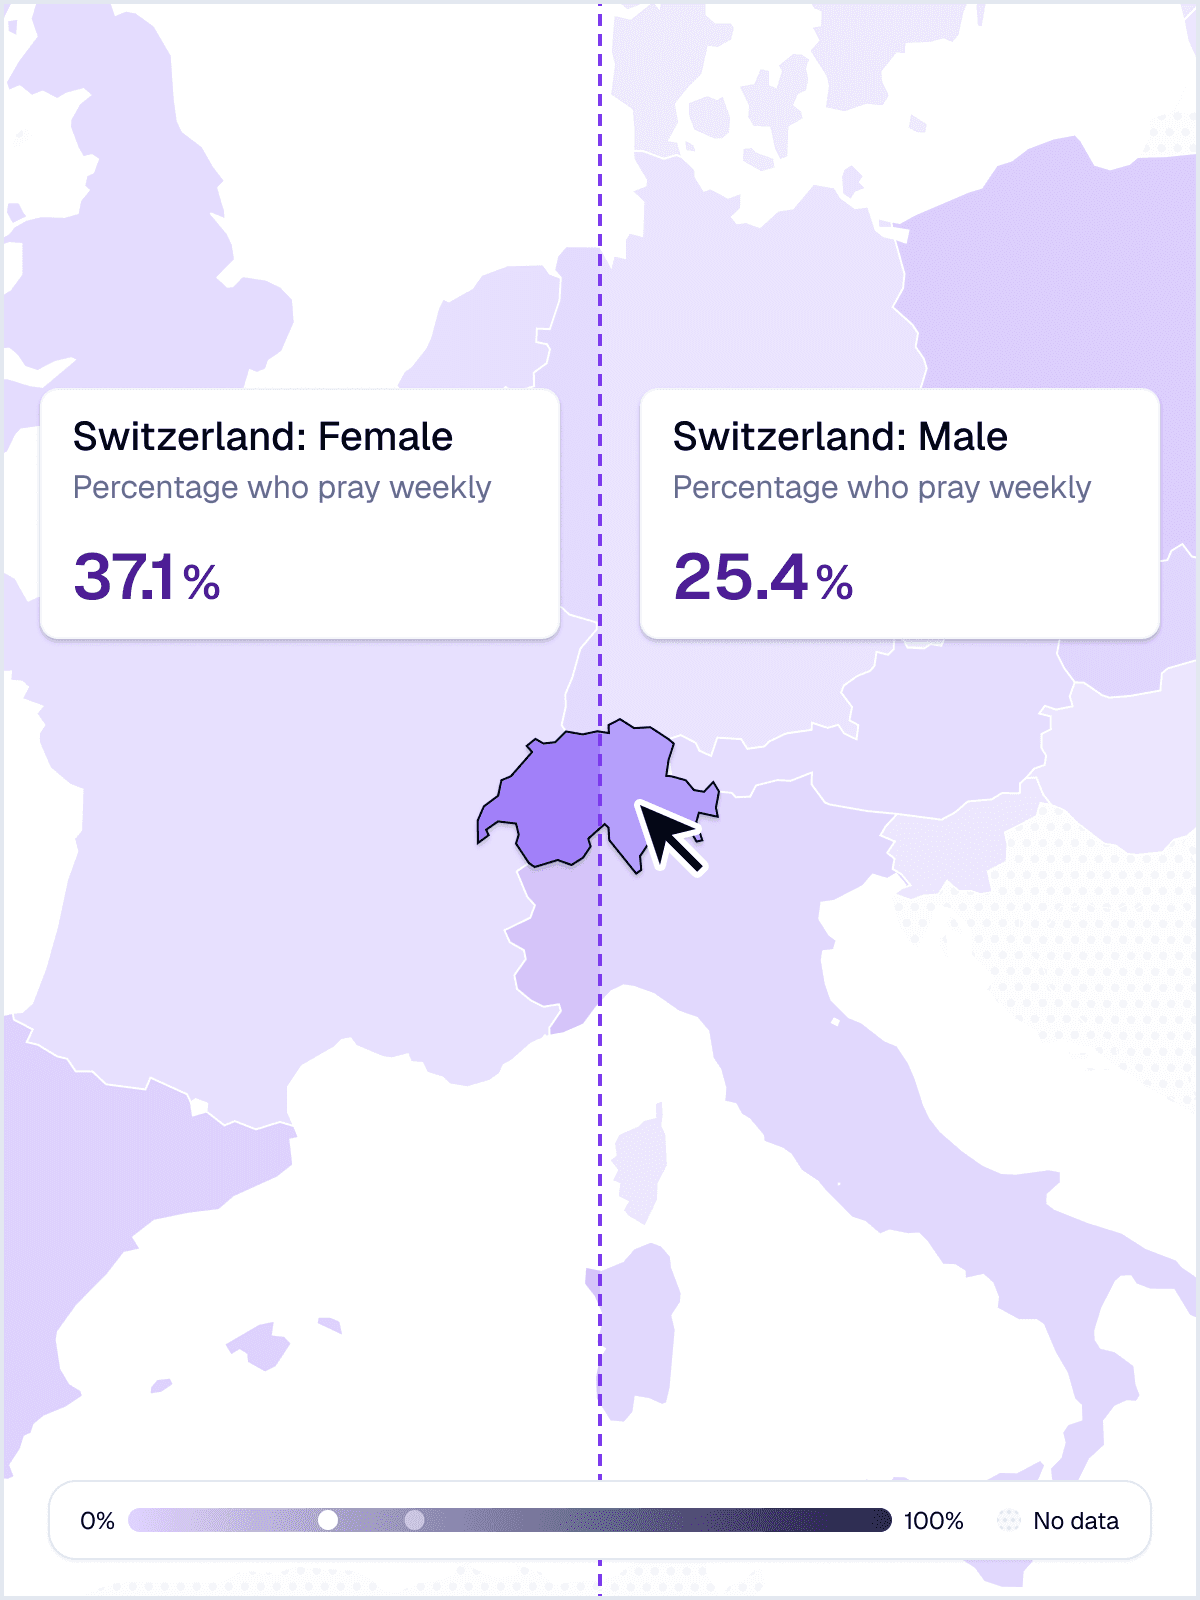
Compare results across demographic groups
Side-by-side comparisons show how attitudes differ across demographic groups. Users can analyze the same indicator broken down by sex, age group, or education level, surfacing patterns that aggregate figures often obscure.

Discover curated data stories
Curated data stories bring survey evidence to life around key topics of public interest. Each story combines data, context, and analysis to help users move beyond isolated numbers and better understand what the evidence reveals about social and political change across Europe. To support this, we built a modular authoring system that lets editors compose stories with text and charts drawing on specific views of the survey data.
Details
| Sector | Academia |
| Product | Data Platform |
| Impact | Education & Research |
| Release | September 2026 |
Services
- Experience Design
- Interaction Design
- Interface Design
- Data Visualization
- Data Storytelling
- Frontend Engineering
- Backend Engineering
- Data Management
- Content Management
- Development Operation
- Maintenance & Support
- Project Leadership
- Product Stewardship
Credits
- Mevion Famos
- Michael Schönenberger
- Patrick Browne

Interested in working with us?