

Swisscom
Data Visualization Guidelines
Style guide and templates for creating effective and consistent charts for data analysis and data reporting for Swisscom
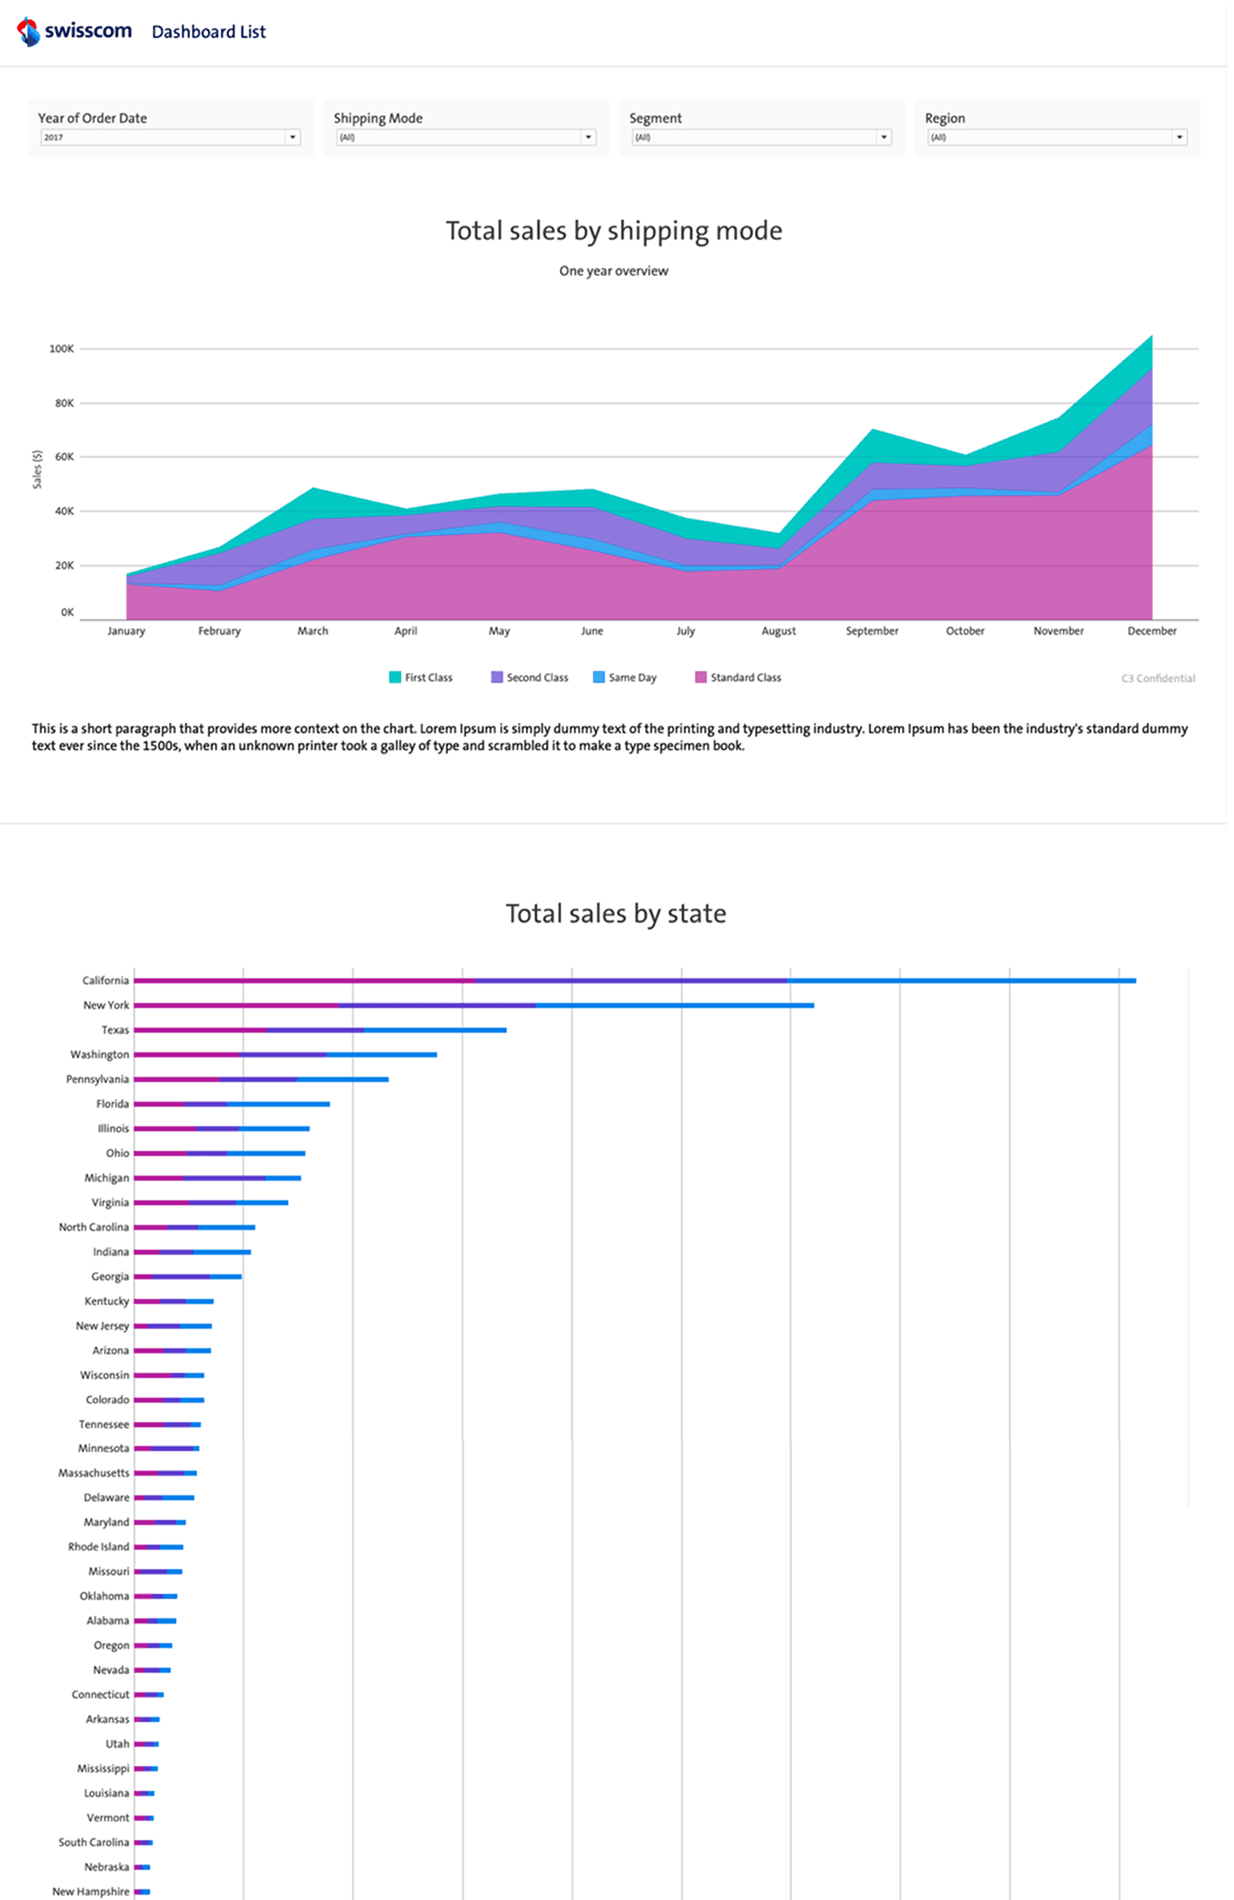
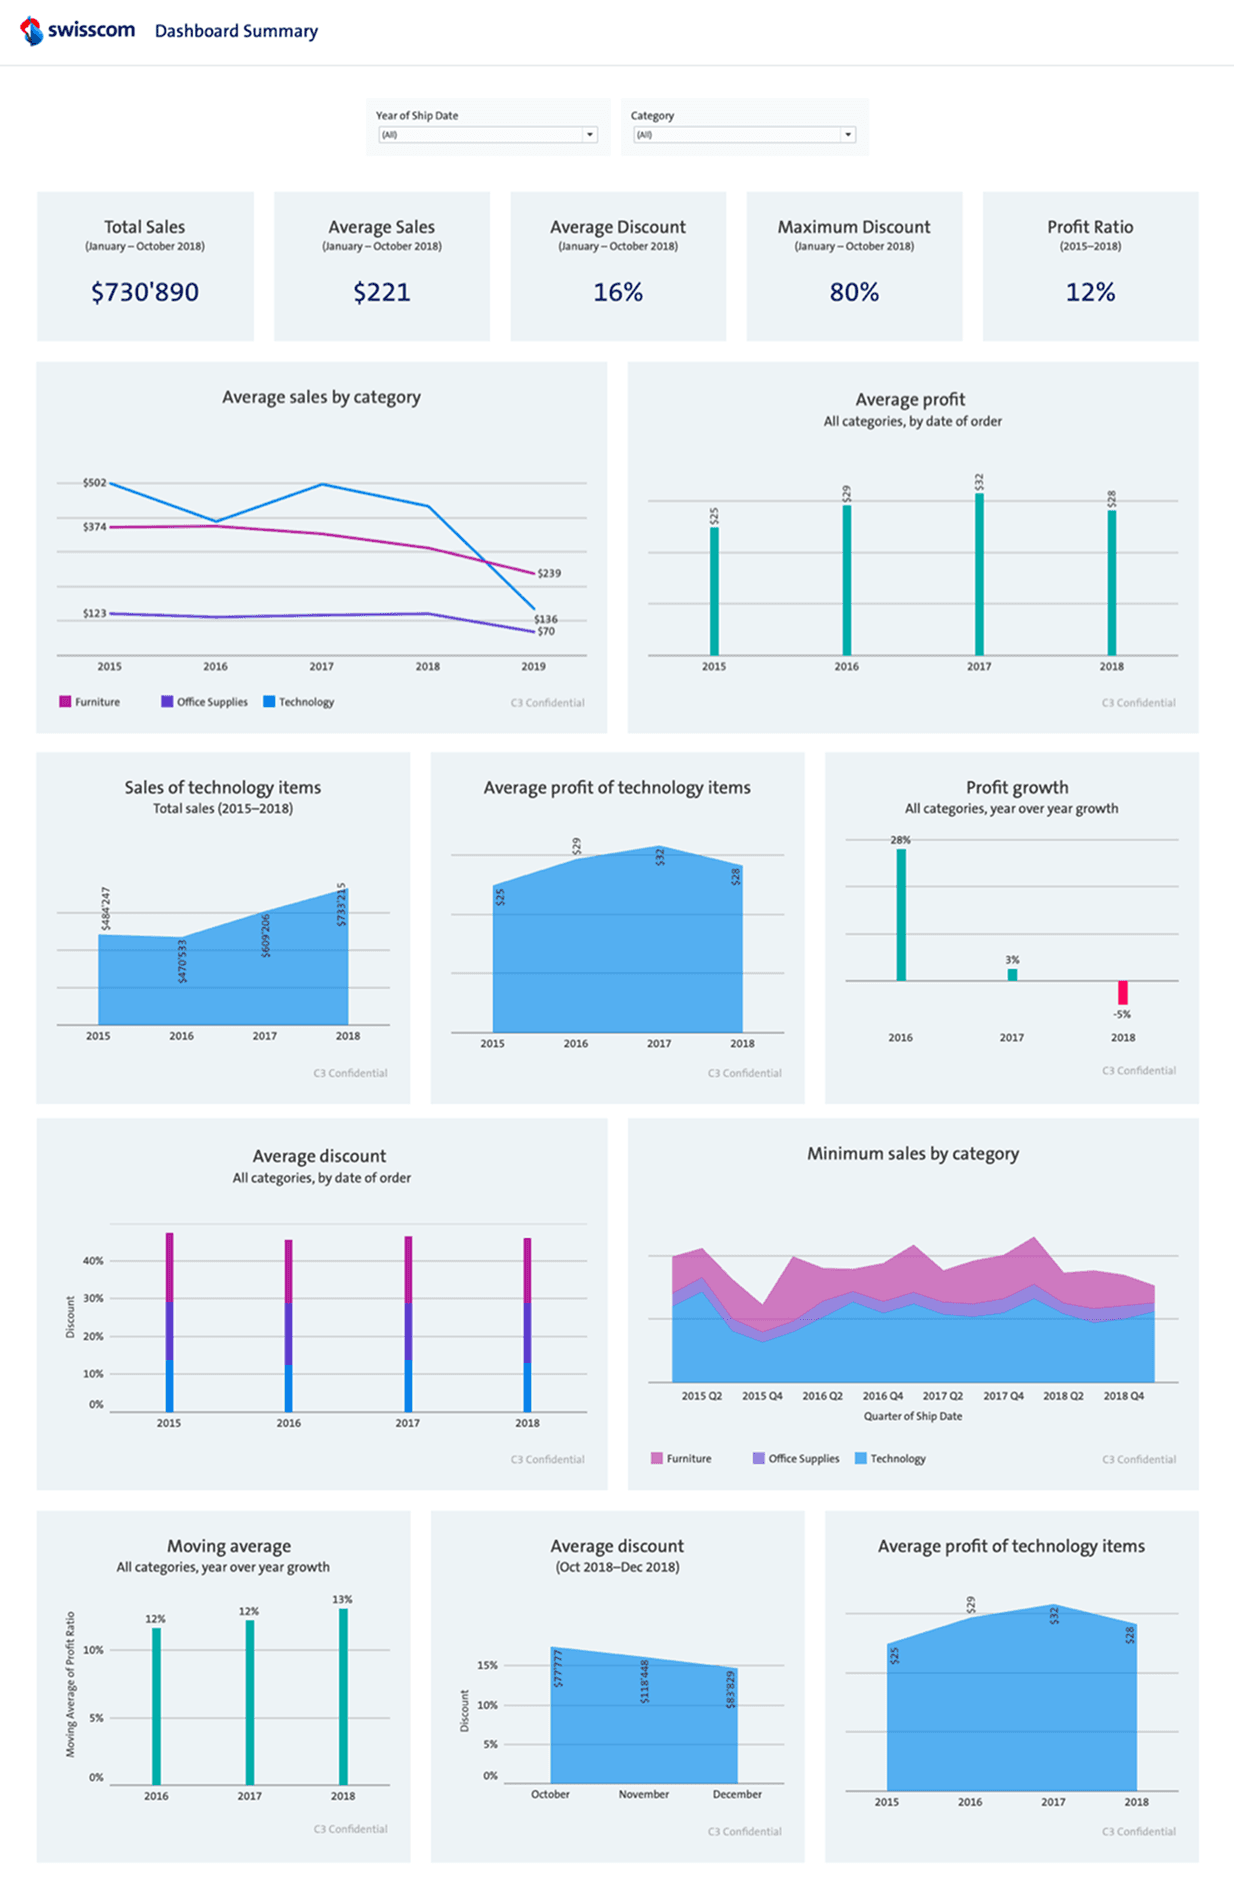
Swisscom analysts use Tableau to make big data visible and understandable and reveal important insights that drive the actions and decisions of internal teams and their clients. To help the organization present data effectively and consistently we established a comprehensive style guide for data visualization with instructions and best practices. Additionally, we have created a custom Tableau template with pre-formatted pages and examples of charts and compositions to support the analysts in the creation of data stories and dashboards.
Details
| Sector | Corporate |
| Product | Design System |
| Impact | Systems & Standards |
| Release | December 2019 |
Services
- Interface Design
- Information Design
- Data Visualization
Credits
- Solange Vogt
- Tania Boa


Interested in working with us?