

Federal Government of Germany
Wellbeing in Germany
Data-driven report on the wellbeing of citizens for the German Government
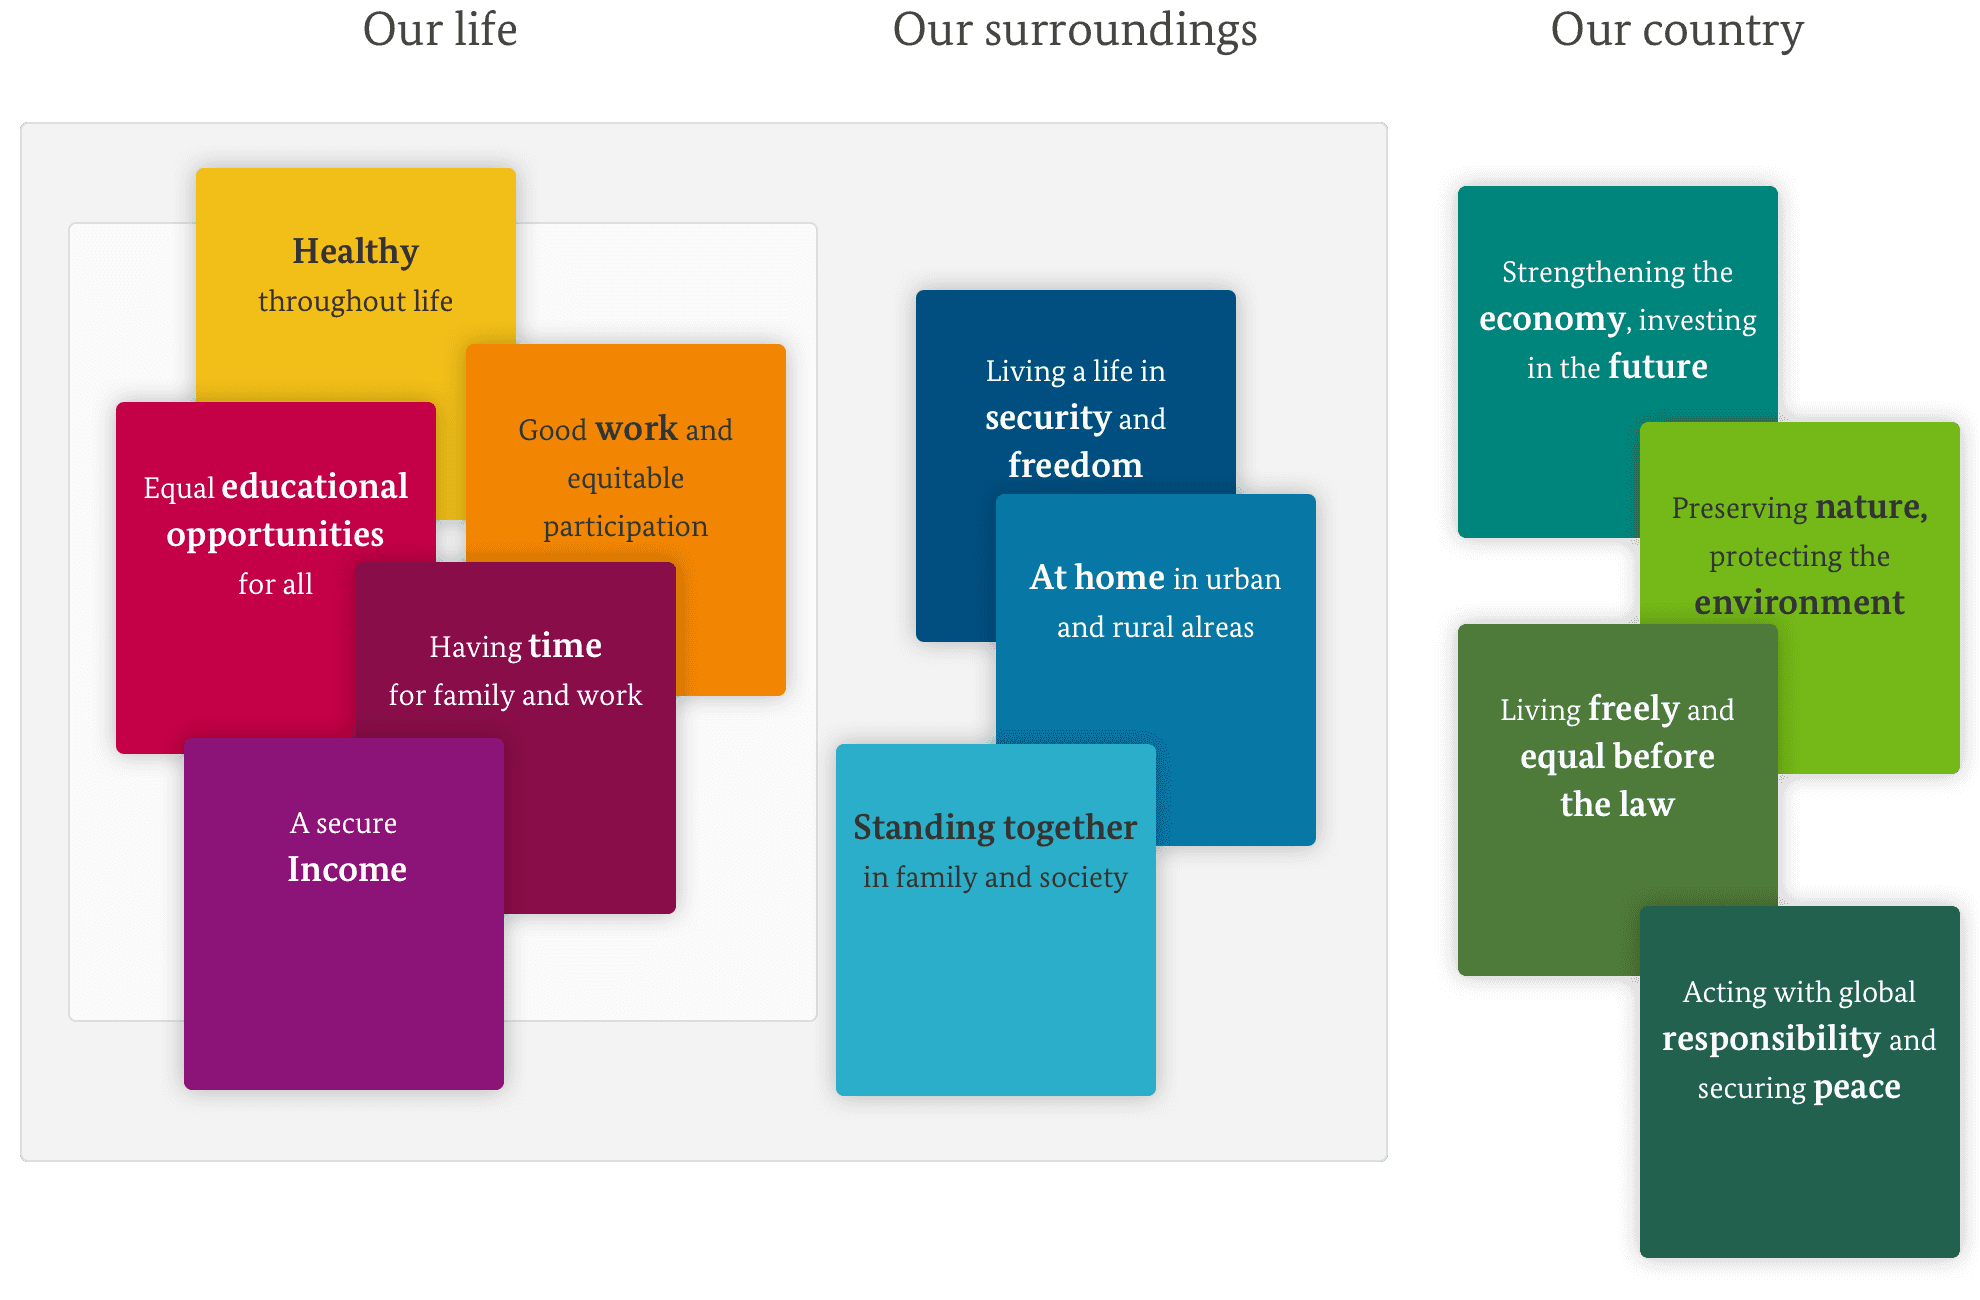
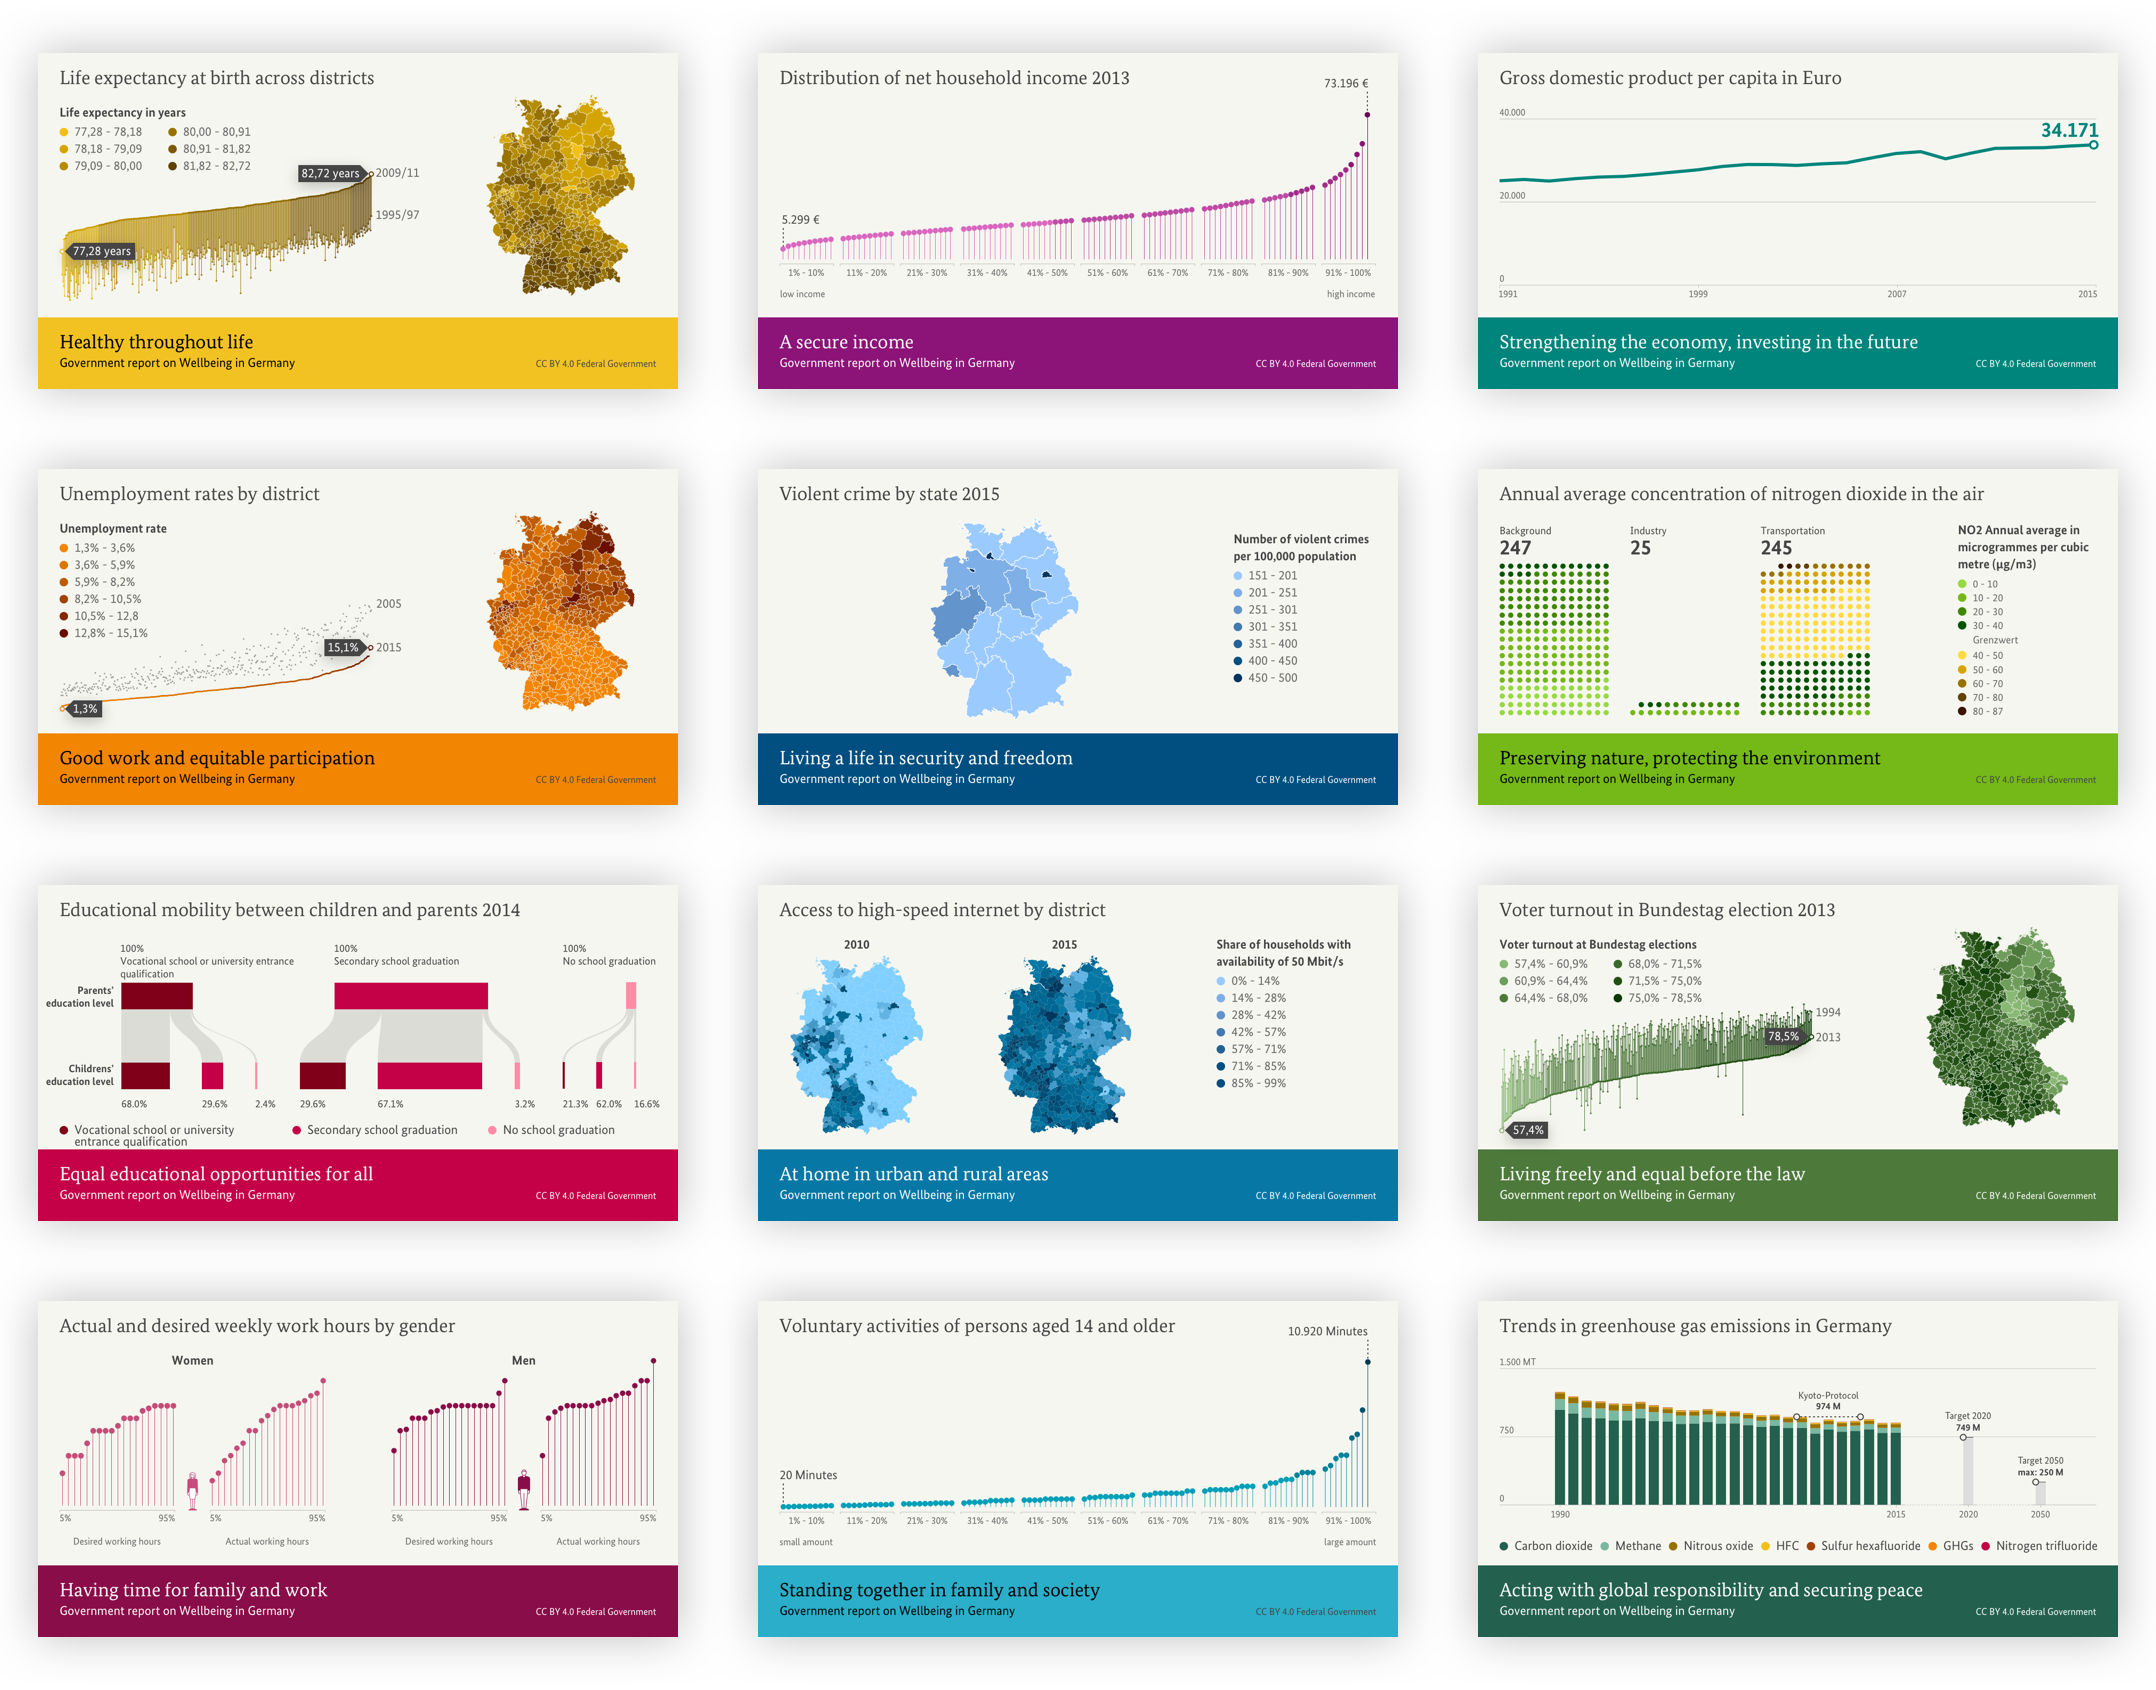
To conclude a two year long study, the German Government commissioned us to create a digital report presenting the gathered facts and gained insights. A total of 46 indicators grouped in 12 dimensions document the current state and future trends of wellbeing in Germany.
One report, different insights
To serve the different needs of our diverse audience groups, the report is structured in two main areas. The interactive report follows a data-driven storytelling approach to explain gained insights in a narrative form. The indicator dashboard offers statistical background information with the options to access the underlying data and download the charts.
Flagship visualizations
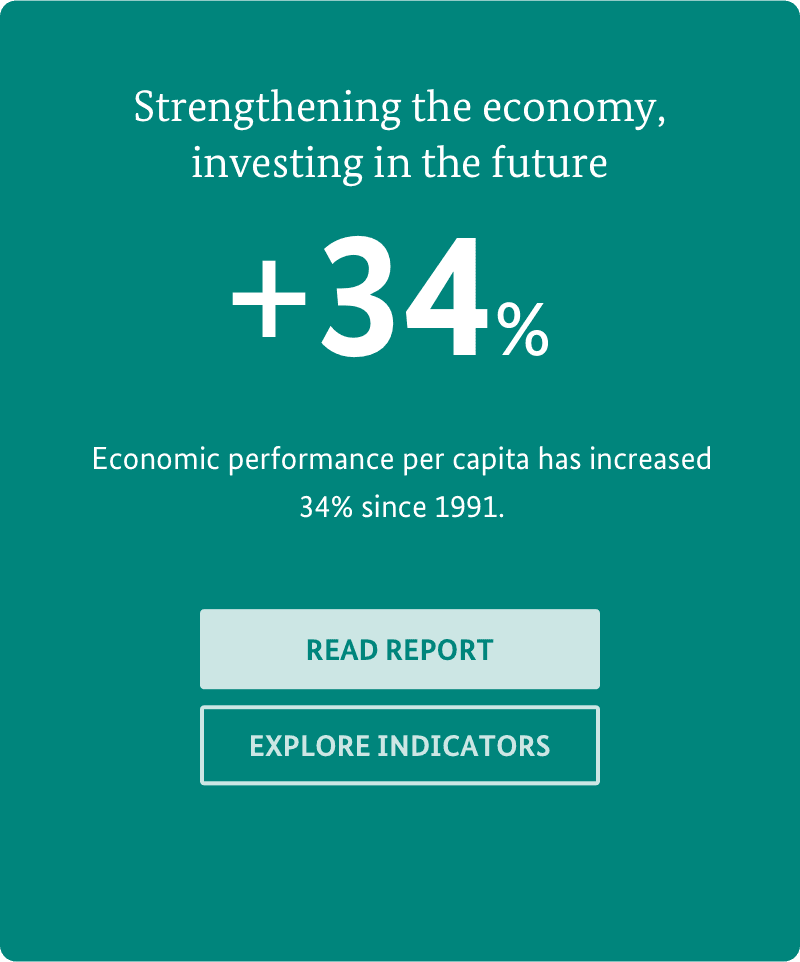
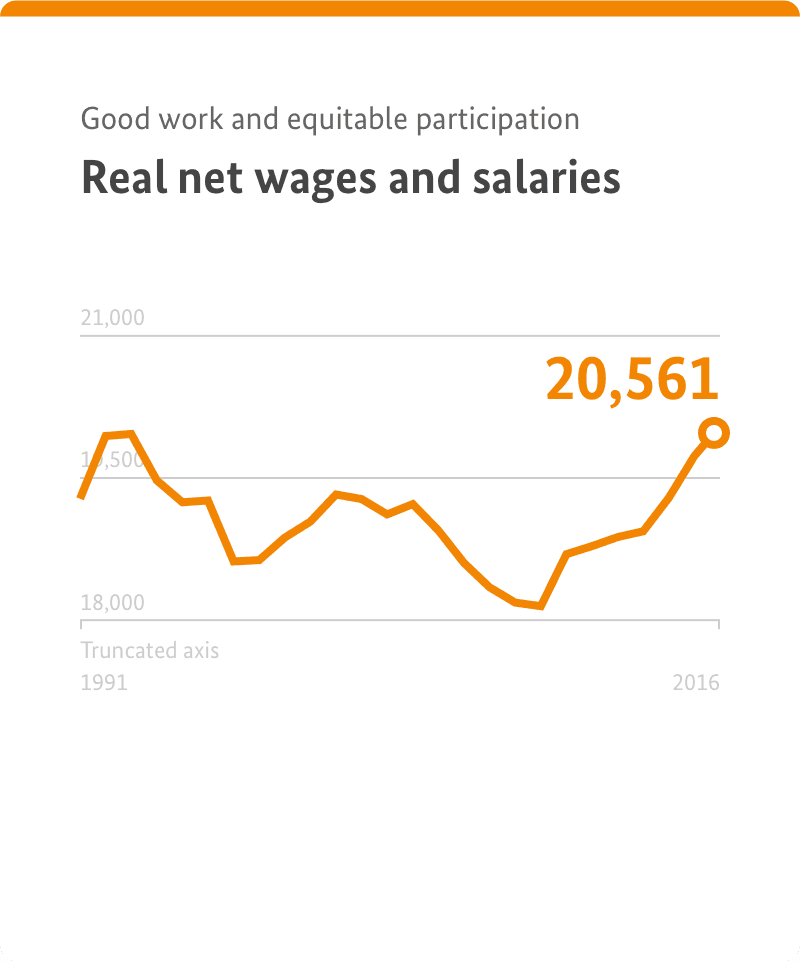
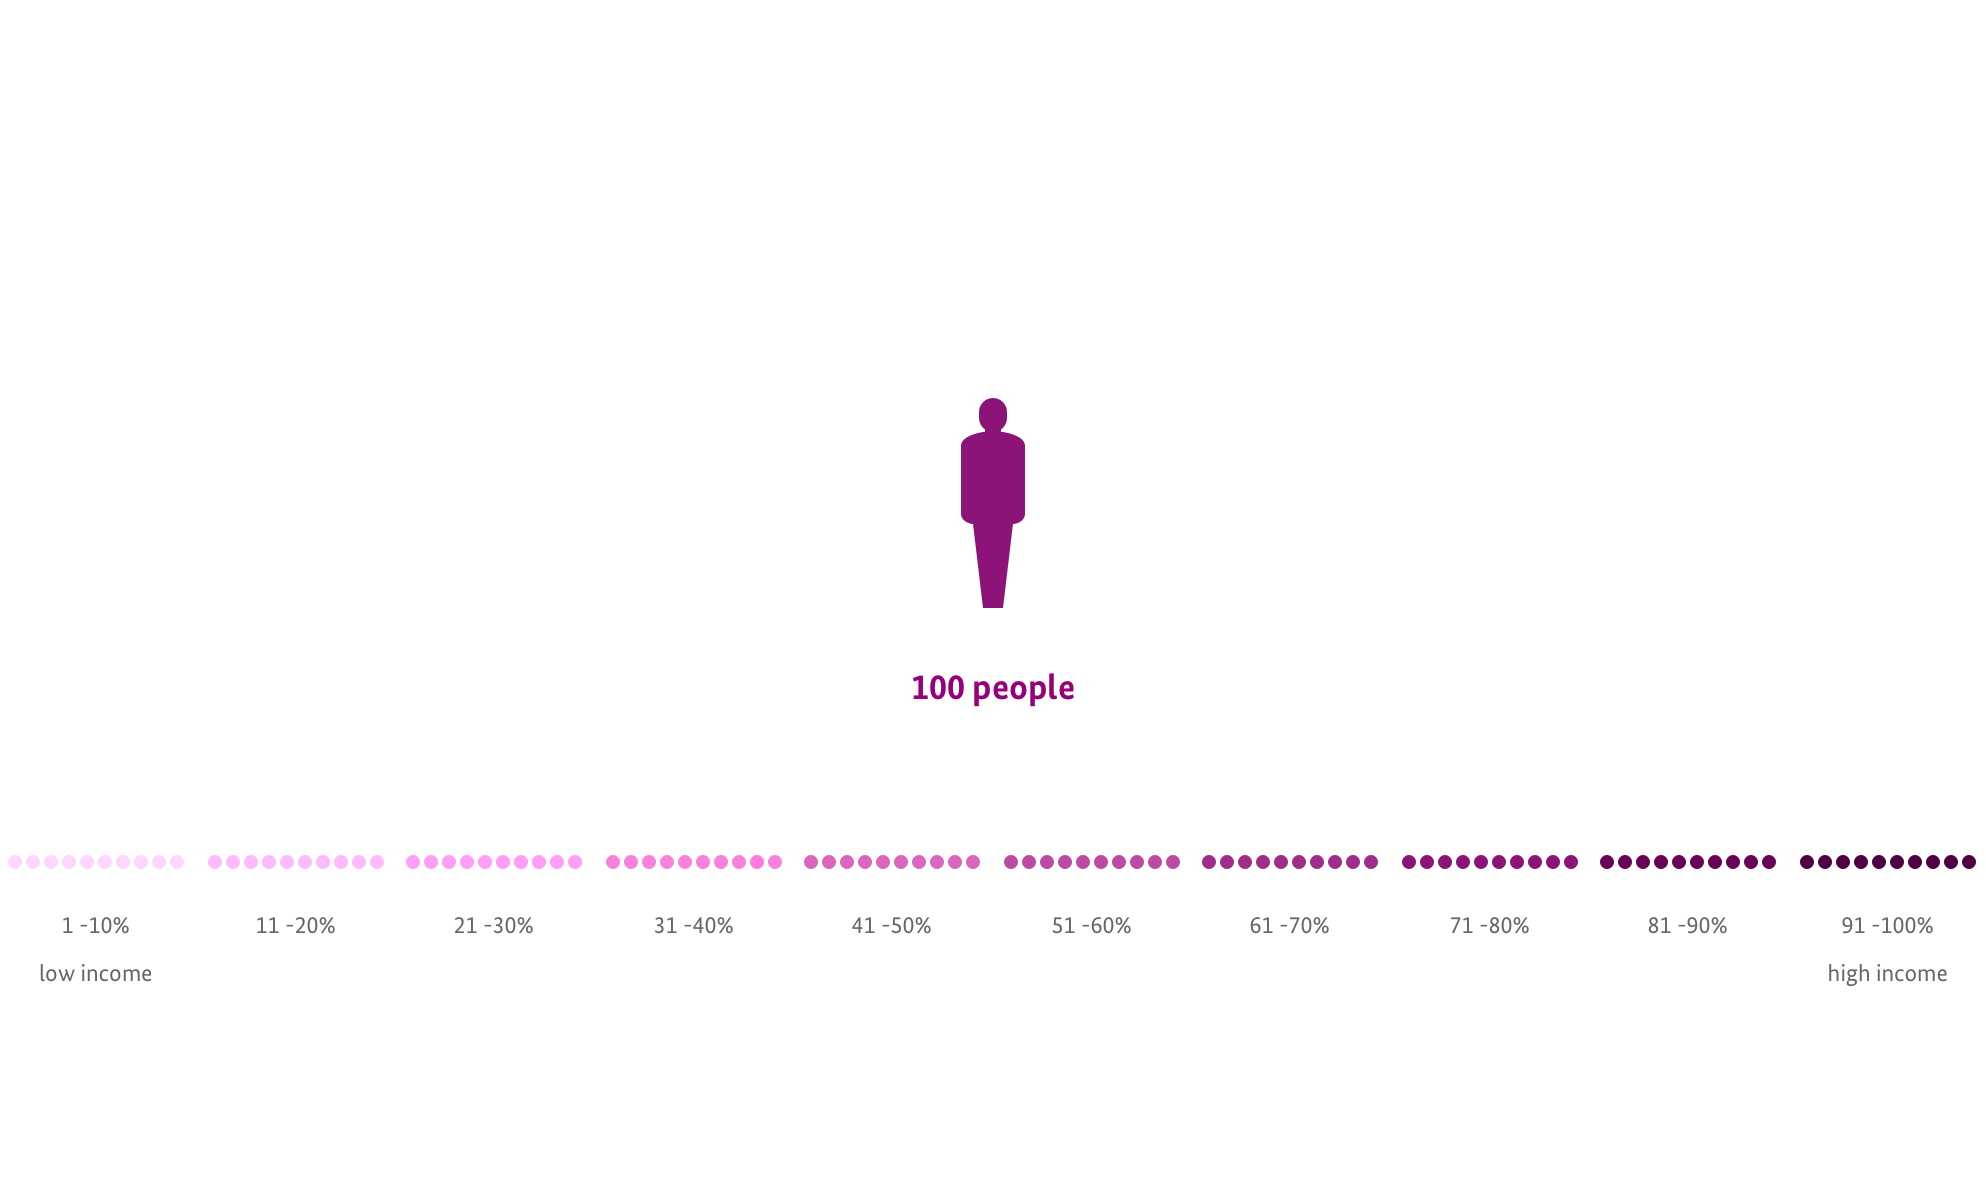
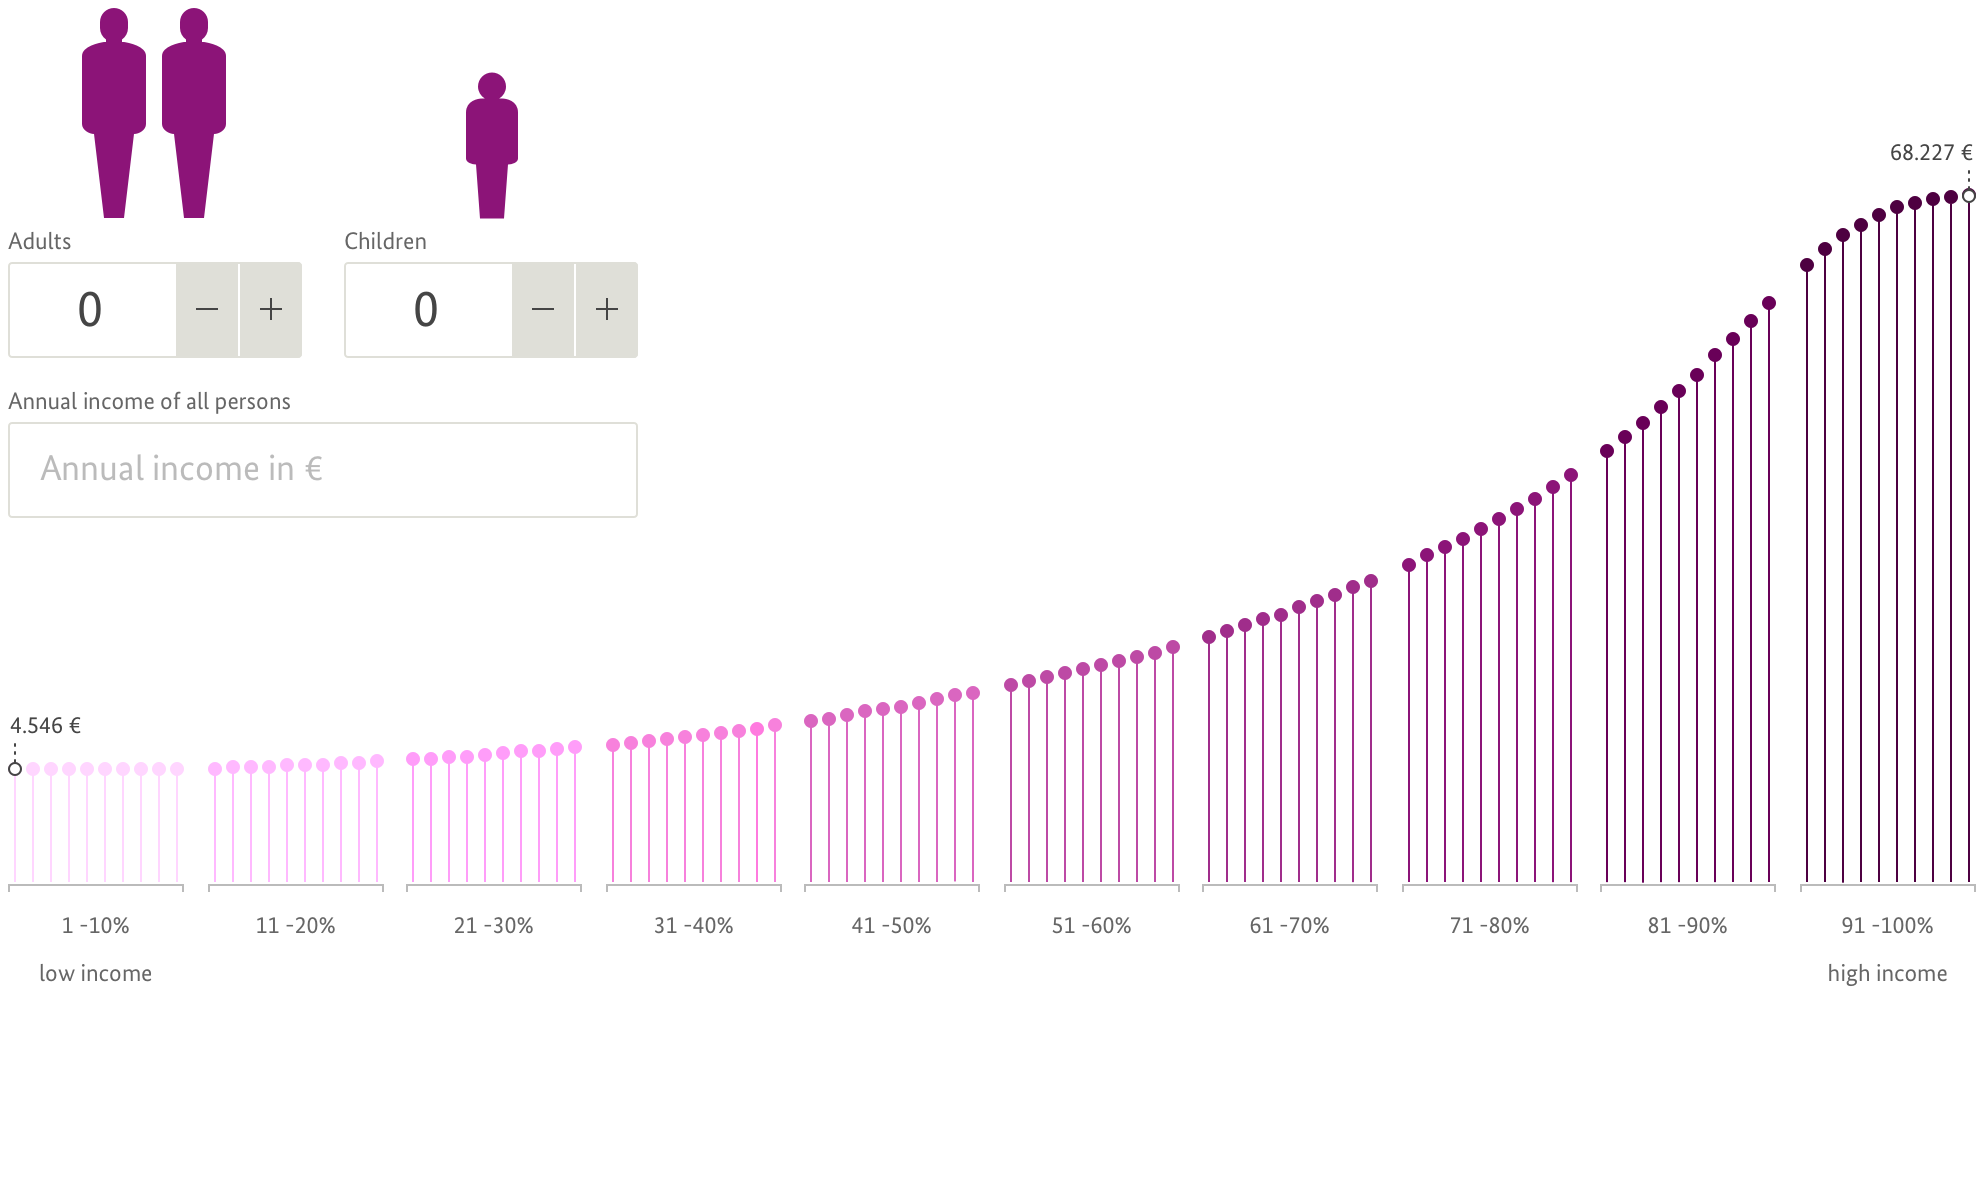
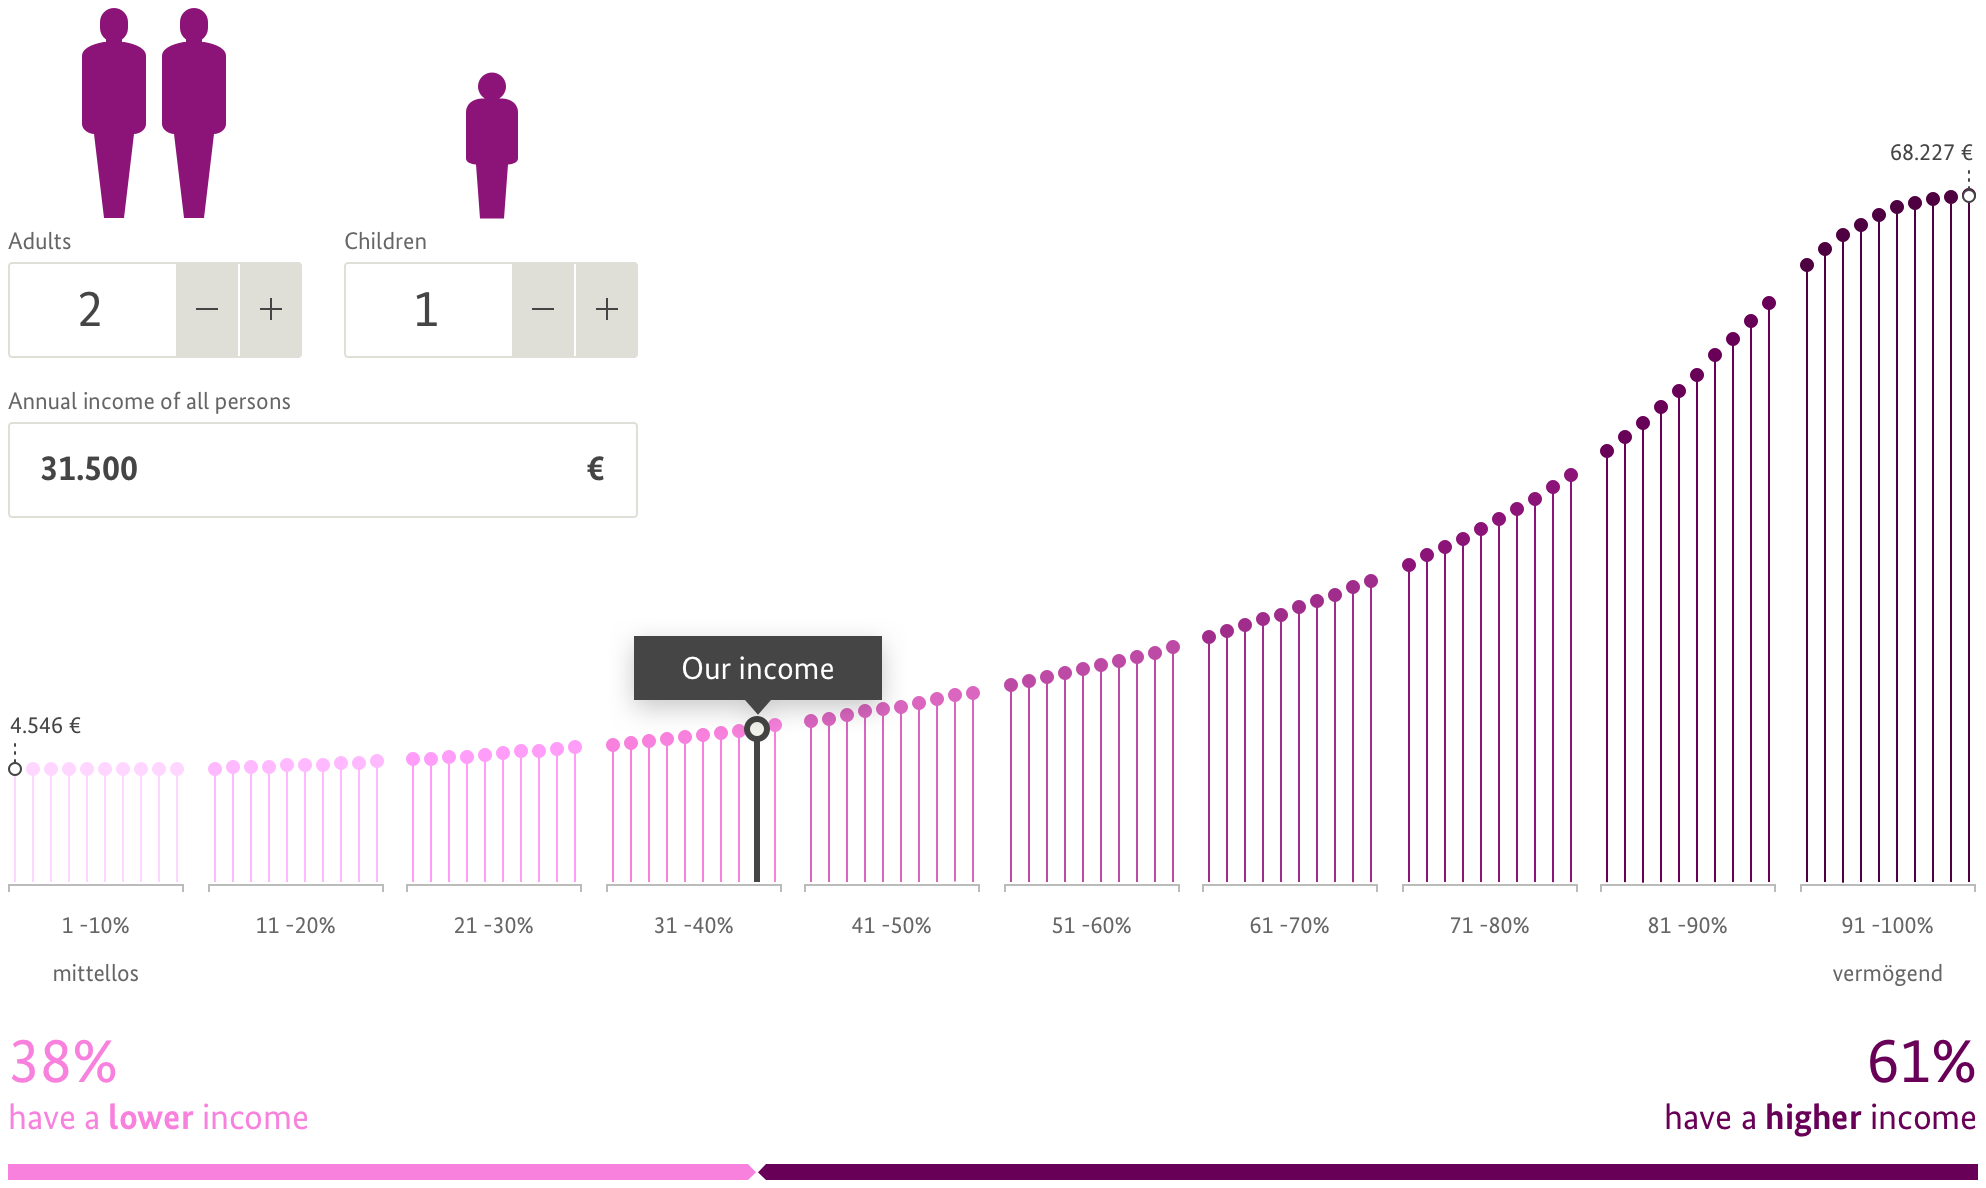
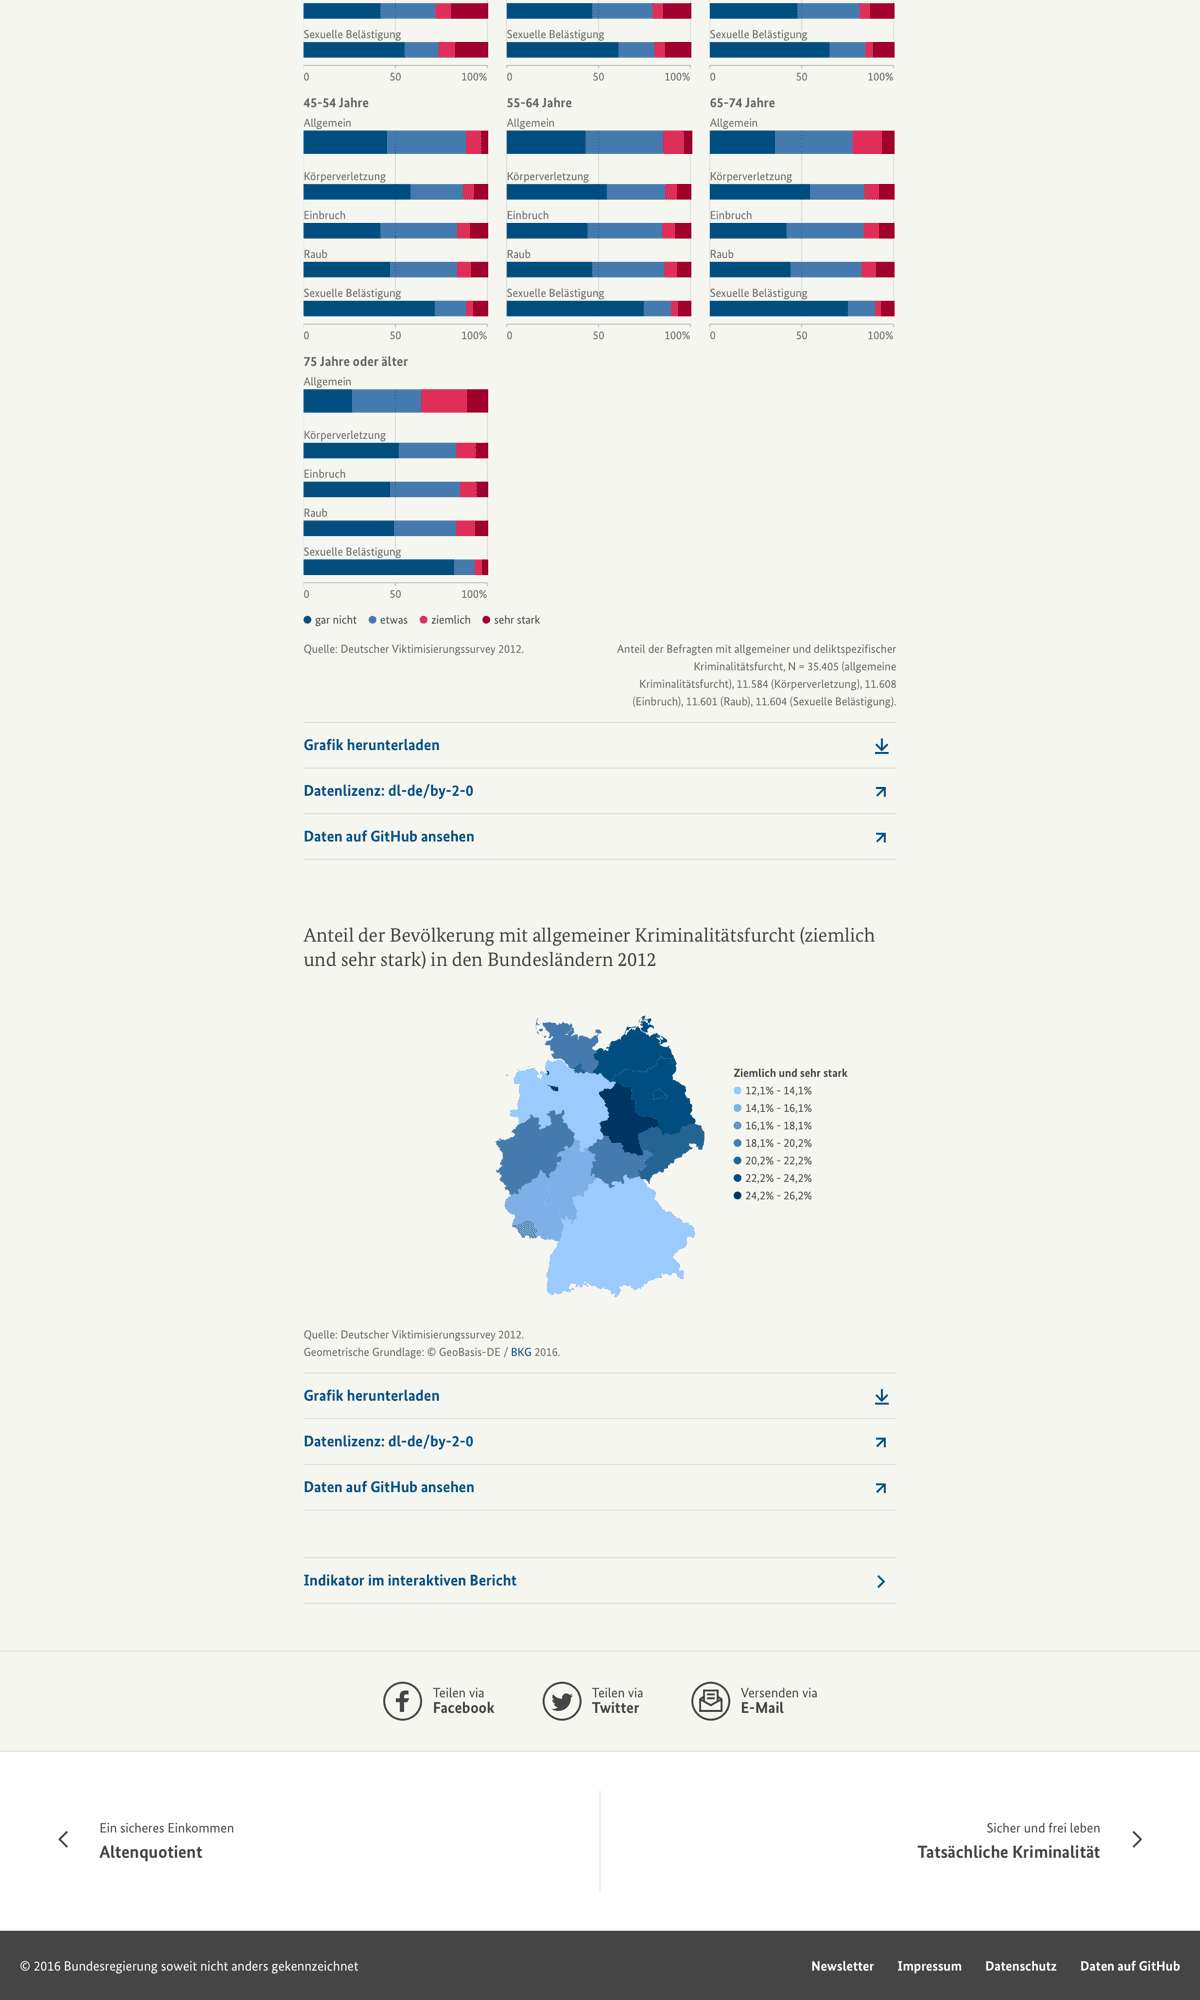
For each of the twelve dimensions we purposefully selected and highlighted one single indicator. We wrapped them in playful and interactive visualizations which allow our users to see their personal data in comparison to the overall dataset. The flagship visualizations were designed to support a visual narrative and stand out with custom views specifically tailored for the report.
Accessibility compliance
The Federal Government values accessibility and inclusiveness of their web content above everything else. Adhering to the WCAG 2.0 guidelines was a strong requirement from the very beginning of the project and influenced the design process as well as the final experience of the report in a lasting way.

Details
| Sector | Government |
| Product | Data Storytelling |
| Impact | Progress & Equity |
| Release | October 2016 |
Services
- Interaction Design
- Interface Design
- Data Visualization
- Software Engineering
- Content Management
Credits
- Benjamin Wiederkehr
- Christoph Schmid
- Ece Kavlak
- Jeremy Stucki
- Tania Boa
- Thomas Preusse
- Tomas Carnecky

Interested in working with us?